Here is my animation for the research project so far. The movie is created in iMovie. The first image is from SketchUp and rendered in Podium. The animated furniture is created in Form Z.
Tuesday, April 21, 2009
Wednesday, March 25, 2009
Assignment: "Let the (Indirect) Sun Shine In"
Let the (Indirect) Sun Shine In
http://continuingeducation.construction.com/article.php?L=5&C=406&P=1
Energy Software to Link Design and Science by B.J. Novitski
http://www.architectureweek.com/2000/0705/tools_1-1.html
Computer Visualization as a Tool for Critical Analysis by Mark Maddalina
http://www.architectureweek.com/2000/0705/tools_4-1.html
The article “Let the (Indirect) Sun Shine In” is about how art museums are looking at using indirect sunlight to light their galleries instead of using electric lights on individual works. This is because daylight can render colors perfectly, and it also makes the building space more interesting. Designers that incorporate daylight into exhibition areas have to deal with a multitude of challenges. Artwork can be damaged if it is exposed to too much light, and designers must also create visually comfortable conditions for visitors. Designers and architects must work in an integrated team to analyze site conditions and weather data, establish the orientation and geometry of a building, and position and size apertures. One of the best tools to do this is the computer.
There are computer programs designed to test light levels in spaces. By having a 3D model of a building, the architect can find out how strong the light is in different areas of the space. An example of this is the BCAM building in Los Angeles. The Renzo Piano Building Workshop has been hired to design a projected 40,000-square-foot, single-story daylit exhibition space as an addition to the building. To determine the primary direction of illumination within the gallery space an illumination vector analysis was taken. This analysis includes light passing through the skylight from the north and light reflected between inclined sunshades. “As a result of the study, designers refined the sunshade, adding a “kicker” at its bottom edge. This 3-foot-tall vertical element bounces light back to the south-facing wall, creating more uniform daylighting conditions.”
Another example of computer technology to help lighting design is the Queens Museum of Art in New York. A new addition to the building will be added in the fall of 2010. The central element in the QMA plan is a new “large works” gallery with a 55-by-40-foot fixed baffled skylight inserted in the roof above. Surrounding the new skylight with frosted-glass fins, there will be a 30-foot-tall structure suspended from the roof trusses and floating about 10 feet from the gallery floor. The hanging element, along with fabric baffles, reflect, refract, and diffuse daylight passing through the new skylight and also direct it to side galleries. These seven smaller galleries have fixed aluminum louvered ceilings that further reflect and diffuse daylight. This prevents direct light from hitting artwork and controls diffuse and scattered light.
In order to analyze their performance targets, the design team conducted extensive modeling of the museum’s spaces and the architectural elements. For example, they performed an examination of the relationship between roof aperture configuration and side-gallery daylighting levels. Using the simulation program Radiance, consultants placed virtual sensors in each gallery. They were then able to chart the amount of light falling on wall surfaces by manipulating the skylight size and shape. The goal of the study was to come as close as possible to the annual reciprocity target without exceeding it. They also closely examined the aluminum louvers over the smaller galleries, conducting a solar-ray analysis for various shapes, angles, and spacing. This caused the designers to select louvers with elliptical sections, varying their slant and spacing them closer together near the wall adjacent to the large-works gallery. The arrangement provides reflective surface area where it is needed most to direct light back toward the wall closest to the light source.
These two examples show how computer technology can help design buildings to function accurately. Instead of testing the building after it is built, architects can eliminate problems before the building stage.
Energy Software to Link Design and Science is an article that talks about how computer technology can predict energy levels in a building. A program called BDA maintains an object-oriented model of a building, and links the building data to various simulation tools. These tools include DOE-2 for energy performance calculation and Delight for daylight and electric lighting analysis. This article is from 1999, so since then, more sophisticated software has been developed.
Computer Visualization as a Tool for Critical Analysis is also an article that talks about computer software that analyses space. This article is examining the space within Frank Lloyd Wright’s Martin House. The relationships between the space and fireplace could only be seen through this computer analysis. “In combining the conceptual spatial model with the more realistic chimney model, there appears to be a conflict within the Martin House design where the space of the second floor hall encounters the form of the chimney mass.” This analysis shows how the computer can provide a new way of seeing and evaluating architectural design.
Wednesday, March 18, 2009
Research Project Draft
Abstract
For my project investigation, I will use a computer program to create an animation for my model. I had designed a multi-purpose dorm room furniture piece last semester with several movable parts. In presenting it, I would show a still image of the digital model with open parts and then with closed parts. It would have been beneficial to show the parts moving. I would like to create a digital model of this furniture that can be animated to move. I will also make it interactive. I will use a computer program to allow you to click on different parts to open and close them. This will help others understand the design much better.
The final product will be a nicely rendered model of the dorm furniture with an animation. The animation will show how the drawers pull out and how the desk and bed fold down.
Introduction/ Project Description
Animation from the digital world is used in video games, movies, and many other applications. We see it all the time but rarely know how it is done. Animation in general uses a series of images that when put together, they appear in our minds as movement. Before computers, animation had to be created entirely by hand. Each and every clip must be drawn out. Now, with computers, keyframes can be made, and the computer can fill in the inbetween frames through interpolation.
3D modeling programs used in architecture and design have an animation capability. Most animations in these programs are walk through animations. Several views of the scene are chosen, and the computer will fill in the motion between these views. Other types of animation can make specific parts of a model move, much like the characters in movie animation. This is the type of animation I will learn for my project. Using my furniture design form last semester, I will create an animation to show how t he individual parts move.
Method
In order for me to create an animation, I must first learn how to in a 3D modeling program. Because I already know how to model in Form Z, I have chosen to use this program to make my animation. I will use the Form Z manual, and help from Sean in the lab to learn how to animate my model.
The first step I must take is to import my SketchUp model into Form Z. I have created layers and groups in SketchUp, but I must allow time for any errors in the transfer. I will most likely have to edit pieces of the model and add new textures to it. If the imported model looks to be too much work to fix, I will have to rebuild the model in Form Z.
After I have a model with appropriate groups and layers, I will be ready to animate the pieces. The rest of my process and process images will be determined as I learn the program and complete the project.
Results/ Outcome and Conclusions
Results and conclusions will later be determined after I have completed the project.
For my project investigation, I will use a computer program to create an animation for my model. I had designed a multi-purpose dorm room furniture piece last semester with several movable parts. In presenting it, I would show a still image of the digital model with open parts and then with closed parts. It would have been beneficial to show the parts moving. I would like to create a digital model of this furniture that can be animated to move. I will also make it interactive. I will use a computer program to allow you to click on different parts to open and close them. This will help others understand the design much better.
The final product will be a nicely rendered model of the dorm furniture with an animation. The animation will show how the drawers pull out and how the desk and bed fold down.
Introduction/ Project Description
Animation from the digital world is used in video games, movies, and many other applications. We see it all the time but rarely know how it is done. Animation in general uses a series of images that when put together, they appear in our minds as movement. Before computers, animation had to be created entirely by hand. Each and every clip must be drawn out. Now, with computers, keyframes can be made, and the computer can fill in the inbetween frames through interpolation.
3D modeling programs used in architecture and design have an animation capability. Most animations in these programs are walk through animations. Several views of the scene are chosen, and the computer will fill in the motion between these views. Other types of animation can make specific parts of a model move, much like the characters in movie animation. This is the type of animation I will learn for my project. Using my furniture design form last semester, I will create an animation to show how t
Method
In order for me to create an animation, I must first learn how to in a 3D modeling program. Because I already know how to model in Form Z, I have chosen to use this program to make my animation. I will use the Form Z manual, and help from Sean in the lab to learn how to animate my model.
The first step I must take is to import my SketchUp model into Form Z. I have created layers and groups in SketchUp, but I must allow time for any errors in the transfer. I will most likely have to edit pieces of the model and add new textures to it. If the imported model looks to be too much work to fix, I will have to rebuild the model in Form Z.
After I have a model with appropriate groups and layers, I will be ready to animate the pieces. The rest of my process and process images will be determined as I learn the program and complete the project.
Results/ Outcome and Conclusions
Results and conclusions will later be determined after I have completed the project.
Tuesday, March 17, 2009
Design, Art, and Technology Symposium 2009
At the Design, Art, and Technology Symposium 2009 at High Point University, I attended the Alexander Julian keynote presentation and the Art, Creativity & Entrepreneurship workshop.
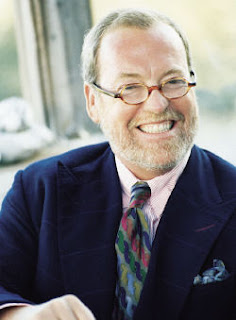
Alexander Julian began his career as a fashion designer. He grew up in Chapel Hill, NC, and his family owned a tailor shop called Julian's. By growing up around clothes in the shop, Julian gained a talent and an interest in clothing design. In the early part of his career, he designed with mostly beige and neutral tones, but later he began to add color. This is what he is known for. Julian has a talent for putting many colors together into a pattern to create something unique and beautiful. Julian is also the first fashion designer to also create his own patterns, textures, and fabrics.
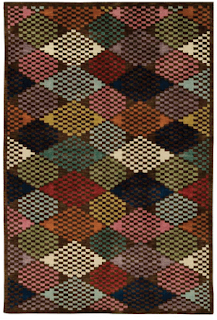
Now, Julian is not only known for his clothes. He also designs furniture, bedding, paint colors, a baseball stadium, and much more. He even has his own wine. All of his designs are inspired by clothes. He explains it as putting an outfit together. An example of this is the argyle pattern in this bed frame.

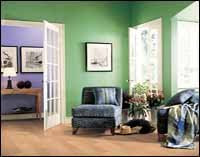
Lowes Paint colors...
The argyle pattern is one of Julian's favorites. This is because people respond to it well. This, as well as many other patterns Julian uses, are timeless. They never go out of fashion, and people always are atracted to them. Julian carries out the argyle pattern in sports as well. The UNC basketball uniform was designed by Julian, and the argyle pattern on the side is now a symbol for UNC sports.

After the presentation by Alexander Julian, I went to the Art, Creativity & Entrepreneurship workshop. My favorite speaker in this presentation was John Murphy, the creator of Stupid Creatures. These creatures are stuffed animals made from old children's clothes. The different fabrics are sewn together to create unique and creative stuffed creatures that children love.


Murphy not only created the stuffed animal creatures, but he has expanded Stupid Creatures to an online comic. This helps to market the creatures. Many toys are sold because they are based on a TV show or a movie, so Murphy made a comic strip to go along with his creatures. There is also a kit you can buy to create your own Stupid Creature. It comes with a book and some socks and tools.


Alexander Julian began his career as a fashion designer. He grew up in Chapel Hill, NC, and his family owned a tailor shop called Julian's. By growing up around clothes in the shop, Julian gained a talent and an interest in clothing design. In the early part of his career, he designed with mostly beige and neutral tones, but later he began to add color. This is what he is known for. Julian has a talent for putting many colors together into a pattern to create something unique and beautiful. Julian is also the first fashion designer to also create his own patterns, textures, and fabrics.

Now, Julian is not only known for his clothes. He also designs furniture, bedding, paint colors, a baseball stadium, and much more. He even has his own wine. All of his designs are inspired by clothes. He explains it as putting an outfit together. An example of this is the argyle pattern in this bed frame.

Lowes Paint colors...

The argyle pattern is one of Julian's favorites. This is because people respond to it well. This, as well as many other patterns Julian uses, are timeless. They never go out of fashion, and people always are atracted to them. Julian carries out the argyle pattern in sports as well. The UNC basketball uniform was designed by Julian, and the argyle pattern on the side is now a symbol for UNC sports.

After the presentation by Alexander Julian, I went to the Art, Creativity & Entrepreneurship workshop. My favorite speaker in this presentation was John Murphy, the creator of Stupid Creatures. These creatures are stuffed animals made from old children's clothes. The different fabrics are sewn together to create unique and creative stuffed creatures that children love.


Murphy not only created the stuffed animal creatures, but he has expanded Stupid Creatures to an online comic. This helps to market the creatures. Many toys are sold because they are based on a TV show or a movie, so Murphy made a comic strip to go along with his creatures. There is also a kit you can buy to create your own Stupid Creature. It comes with a book and some socks and tools.

Monday, March 16, 2009
Week 7 Assignment
Mapping Places and Spaces
Geographic information systems are important tools for defining the social and environmental contexts of urban design, planning, and architecture
by Bill McGarigle
http://archrecord.construction.com/features/digital/archives/0206feature-1.asp
This article is about geographic information systems (GIS). This is a type of software system that enables someone to link any amount or kind of data to a location by geographic- or user-defined coordinates. This information can then be analyzed to find relationships and trends. Then, the results can be viewed in 2D or 3D map layers. Each layer will represent a specific type or class of information, such as wetlands, wildlife habitats, crime statistics, or various types of demographics. This tool is great for planning projects in urban design or in architecture.
Often times when an architect is given a project, there is a lot of research that must be done on the site. Income of people living in the area, population, and many other factors can affect a design and the future success of a project. GIS is a way that an architect can look at all this information at once. Sometimes, this information is already there for them because of the GIS. The GIS will put all types of information into one map with many layers.
This also makes city planning much easier. It can help planners decide the best areas to build different types of buildings and roads just by looking at one map instead of many. Then, the GIS can help predict what will happen over time. This further helps planners make decisions before they start building.
One example of the use of GIS is in Los Angeles. GIS was used to conduct an environmental-justice analysis to determine whether distribution of environmental impacts from a proposed expansion of LAX would mostly fall on minority and low-income communities. Using demographic data from the census and from federal guidelines, GIS specialists first identified the socioeconomic profiles of several communities close to LAX. Then on other layers, they showed environmental-impact data. This data was centered primarily on aircraft and construction noise, traffic patterns, and air quality. Because of the GIS, they could see who the affected populations were, and what communities they were in. The team also overlaid noise contours onto maps showing individual property boundaries to determine the exact numbers of households and populations that would be affected by aircraft noise.
Another example of using GIS is in the redevelopment department of Glendale, Colorado (population 4,527). They recently used CommunityViz to inform a communitywide master plan focusing on a series of proposed redevelopment projects. A variety of layers were put into the program such as transportation, education, land use, utilities, tax-revenue generation, and cost of services. These were assessed as the plan was developed, and the software was also used to model alternative building plans and land-use scenarios. The goal was to create a “walkable” community, affordable housing, and a new retail model to increase tax revenue and provide ownership opportunities. The project will involve architecture, landscape architecture, urban design, and economic analysis. GIS helped to create a 3D physical plan detailed enough to measure conformance of proposals with community standards for growth.
GIS can be a great tool for working with scales as large as cities and as small as individual buildings. By “three-dimensionalizing” social and environmental impacts of proposed planning scenarios, it can help architects recognize patterns and resolve conflicts. GIS not only maps out the social and environmental data for areas of design, planning, and architecture, but it helps people visualize how a space can be inhabited. It is almost as if GIS is a tool to predict the future of a building project.
Wednesday, March 4, 2009
DIVE


During our visit to the DIVE facility at Duke University, we were able to experience a six sided virtual reality room. The room had projections on the exterior side of the walls, floor, and ceiling. Different programs were designed to make 3D experiences in this room. Each person was given a pair of 3D glasses. One person had the master pair of glasses. This is the pair of glasses that has a tracking device to where the person is within the room. The person wearing the glasses will see an accurate perspective in the 3D virtual reality world. However, the other people will see distorted perspectives unless they are right near the master glasses.

My favorite program in the virtual reality was the kitchen. When wearing the 3D glasses, it looks as if you are standing in a kitchen with counters, stove, refrigerator, sink, etc. Using a clicker, you can pick up and move objects in the room. The kitchen design was made to test stress levels. The person is given nine minutes to pack a bagged lunch and find their keys and cell phone. While they are completing these tasks, sounds are playing in the background. The sounds progressively get worse to increase the person’s stress level. The trick is that there are no keys or cell phone in the room. I liked this room because you could interact with it by moving things around.


Monday, March 2, 2009
INTERNET AND ANIMATION Assignment
From the readings:
"2D and 3D Animation and Video" by Anne Spalter, Addison Wesley Longman Inc. 1999, pp 323-358.
"The World Wide Web" from The Computer in the Visual Arts by Anne Spalter, Addison Wesley Longman Inc. 1999, pp 415-437.
"The World Wide Web" gives a brief history of the Internet and an overview of different aspects of the Internet such as different computer languages. This chapter is good for referencing Internet history and the basics, but much of the information seems outdated. The chapter was written ten years ago, and with the rapid growth of technology and the Internet, much has grown and changed since then. Web designers are still using HTML and other computer languages, but the speed of the Internet has dramatically increased. The amount of people using the Internet has also increased since, increasing the amount of people who view artist’s work.
The Internet is a great tool for artists to get their work out to the public. The chapter talked about art galleries online, but there is more than just that. Artists have their own pages, and blogs are a great tool to spread their art and get feedback. Many pages are also linked to other pages for people who are just searching for art or interesting things to look at. One page I use is stumbleupon.com. This is a tool that can connect you to pages you are interested in. I have seen some very interesting artwork that I normally would have never seen if it were not for the Internet.
One of the sections of this chapter was very interesting to me. I have heard of HTML, and I have used programs that create HTML for you when designing a web page, but I did not know there was a computer language code for 3D. Virtual Reality Modeling Language (VRML) is used to write geometrical forms, lighting and textures used to make 3D renderings. A good example of this is in computer avatars. These are 3D models of people that are used as the computer personality of users on certain sights.
"2D and 3D Animation and Video" is a chapter all about animation and how computers have helped with the animation process. Animation uses a series of images that when put together, they appear in our minds as movement. Before computers, animation had to be created entirely by hand. Each and every clip must be drawn out. Now, with computers, keyframes can be made, and the computer can fill in the inbetween frames through interpolation. Interpolation can sometimes make the motion look choppy and mechanical, so many times, interpolation will only be used for every other frame.
Another helpful tool for animation on computers is morphing. Morphing is a tool used to transform one picture into another. For example, a monkey will fade and change into a person. This is done by connecting similar points in two pictures. Through using a fading technique, the picture appears to have transformed into the other.
Transitional effects are also easily done through the use of computers. The chapter talks about dissolves, and wipes. Dissolves are when one picture fades away into another picture. Wipes are when one picture moves away, revealing another picture. There are many ways that the transition can be carried out. Some examples include page peal, page turn, and paint splatter. These are just a few of the many methods.
All of these computer tools for animation can be used in special programs for creating movies or video in the digital form. I have used Windows Movie Maker to put together a short video for a class. After taking the video, I put it onto the computer, and the computer automatically separated the film into several chunks of clips. I could then edit the movie by placing the clips in the order I wanted. The chunks made it easier to separate the pieces from when we had started and stopped the tape. After arranging and removing clips, sound could be added. A separate timeline was used for the sound. This made it so the sound could play the same time as the movie, and I could start and stop the sound wherever I wanted to during the movie. There were also tools in the program for transitions and for including words for the title and credits.
Already in the past ten or so years, there has been a dramatic increase in technology relating to computer animation and the Internet. This shows that there is much more to come in the future. And for what seems like it could never be possible, may be possible one day. The thought that computers all around the world could be connected was only in the imagination not long ago, and today it is a part of our everyday lives. Who knows what will be to come!
Subscribe to:
Posts (Atom)